
Sar Manager
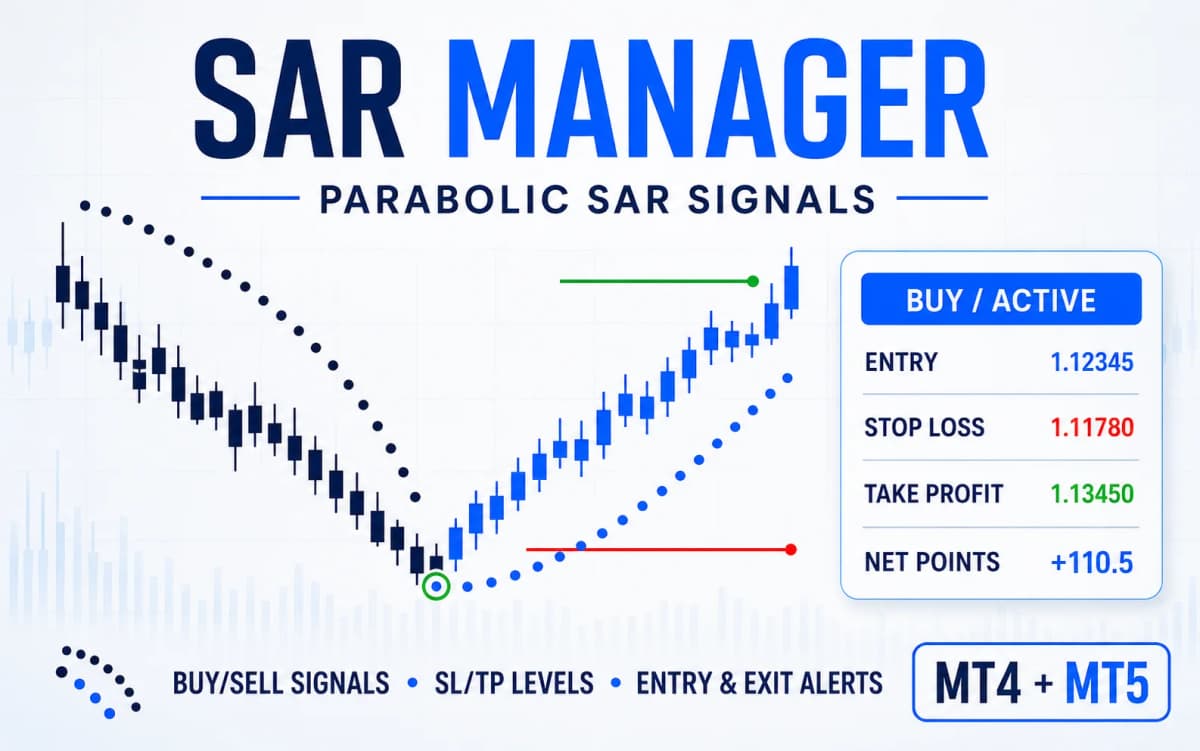
SAR Manager — Visual Control of Parabolic SAR Signals SAR Manager is an advanced information and signal indicator for MetaTrader 5 based on the classic Parabolic SAR.
What the product does
SAR Manager — Visual Control of Parabolic SAR Signals SAR Manager is an advanced information and signal indicator for MetaTrader 5 based on the classic Parabolic SAR.
It transforms standard SAR dots into a complete visual trading system. The indicator identifies market direction, marks entries and exits, calculates virtual Stop Loss and Take Profit levels, sends notifications, and displays signal statistics directly on the chart.
Instead of working with isolated Parabolic SAR dots, the trader receives a clear overview of:
Current SAR direction
BUY or SELL signal
ACTIVE or WAIT position status
Calculated entry price
Stop Loss and Take Profit levels
Entry arrows and exit markers
Virtual trade statistics
Notifications about new events
How SAR Manager Works The indicator monitors the position of Parabolic SAR relative to the price.
A BUY signal appears when SAR moves from above the price to below it. A SELL signal is generated when SAR moves from below the price to above it.
To prevent unstable intrabar signals, a reversal is confirmed only after the candle closes. The calculated entry is then performed at the opening price of the next candle.
This approach creates a clear and consistent signal history: confirmed entries do not disappear or change direction afterward.
Complete Chart Visualization SAR Manager displays all important information directly on the price chart:
Parabolic SAR dots
Green BUY arrows
Red SELL arrows
Virtual position exit markers
Blue Entry line
Red Stop Loss line
Green Take Profit line
Price labels for all trading levels
The lines allow traders to evaluate the potential risk and target of every signal without performing manual calculations.
If required, the indicator can keep the levels of the most recent signal on the chart even after the virtual position has been closed. This is useful for reviewing subsequent price movement.
Stop Loss and Take Profit in Points Stop Loss and Take Profit distances are configured separately in the input parameters.
For BUY signals:
Stop Loss is placed below the entry price
Take Profit is placed above the entry price
For SELL signals:
Stop Loss is placed above the entry price
Take Profit is placed below the entry price
All distances are specified in MetaTrader points. For example, on a five-digit Forex symbol, 100 points are equal to 10 standard pips.
Exit Logic A virtual position can be closed for one of the following reasons:
Stop Loss is reached
Take Profit is reached
An opposite Parabolic SAR signal appears
The market opens beyond the Stop Loss or Take Profit level due to a price gap
If the price opens beyond an established level, the indicator records the exit using the actual candle opening price.
When both Stop Loss and Take Profit are reached within the same historical candle, the exact sequence of price movement cannot be determined from OHLC data alone. SAR Manager therefore provides a dedicated calculation setting:
Stop Loss First — conservative calculation
Take Profit First — alternative calculation
The conservative Stop Loss First rule is used by default.
Advanced Information Panel The information panel displays the current system state and signal results calculated over the selected historical period.
The panel includes:
Symbol and timeframe
Current BUY or SELL signal
ACTIVE or WAIT status
Current SAR direction
Entry price
Stop Loss level
Take Profit level
Risk-to-reward ratio
Number of BUY entries
Number of SELL entries
Number of closed virtual trades
Winning trades
Losing trades
Breakeven trades
Win rate
Total result in points
Reason and price of the latest exit
Color-coded information makes it easy to identify the current direction and distinguish between Entry, Stop Loss, and Take Profit levels.
Entry and Exit Notifications SAR Manager can notify the trader about new signals and virtual position exits.
The following notification methods are supported:
MetaTrader popup alerts
Mobile Push notifications
Email notifications
Sound alerts
Entry and exit notifications can be enabled separately.
An entry notification contains:
BUY or SELL direction
Symbol and timeframe
Entry price
Stop Loss
Take Profit
An exit notification contains:
Direction of the closed position
Exit reason
Exit price
Result in points
After installation, the indicator does not send notifications for old historical signals. Every new event is processed only once, preventing repeated messages on every tick.
Main Features Classic Parabolic SAR logic
Adjustable SAR Step and Maximum parameters
Signals confirmed using closed candles
Calculated entry at the opening of the next candle
Stop Loss and Take Profit in points
Exit on an opposite SAR signal
Price gap processing
Adjustable policy when SL and TP are reached within the same candle
BUY and SELL arrows
Visual exit markers
Entry, Stop Loss, and Take Profit lines
Price labels for trading levels
Option to keep the latest levels after an exit
Detailed information panel
Virtual signal statistics
Popup, Push, Email, and Sound notifications
Separate control of entry and exit notifications
Customizable colors and panel position
Compatible with different symbols and timeframes
Main Input Parameters InpSarStep — Parabolic SAR acceleration step.
InpSarMaximum — maximum SAR acceleration value.
InpStopLossPoints — Stop Loss distance in points.
InpTakeProfitPoints — Take Profit distance in points.
InpArrowOffsetPoints — distance between entry arrows and the price.
InpHistoryBars — number of candles used to calculate signals and statistics.
InpSameBarPolicy — calculation rule when one candle reaches both SL and TP.
InpShowLevelLines — displays Entry, Stop Loss, and Take Profit lines.
InpKeepLastLevels — keeps the most recent levels visible after an exit.
InpEntryAlerts — enables entry notifications.
InpExitAlerts — enables exit notifications.
InpAlertPopup — enables MetaTrader popup alerts.
InpAlertPush — enables mobile Push notifications.
InpAlertEmail — enables email notifications.
InpAlertSound — enables sound alerts.
InpShowPanel — displays the information panel.
Who Is SAR Manager Designed For? SAR Manager is suitable for traders who:
Use Parabolic SAR in their trading
Want clear signals instead of manually interpreting SAR dots
Prefer to know the protective level and target in advance
Analyze signals across different symbols and timeframes
Want to receive notifications without constantly watching the chart
Test different SAR, Stop Loss, and Take Profit settings
Need a clear visual instrument for manual trading
Important Information SAR Manager is an indicator and does not open real market orders.
All positions, levels, and results displayed in the information panel are virtual. The statistics do not include exact historical spreads, commissions, swaps, or possible slippage. Therefore, they should not be treated as a complete strategy backtest.
The indicator provides structured signals and visual information but does not guarantee profitable trading. Test your selected settings on historical data and a demo account before using them in live trading.