
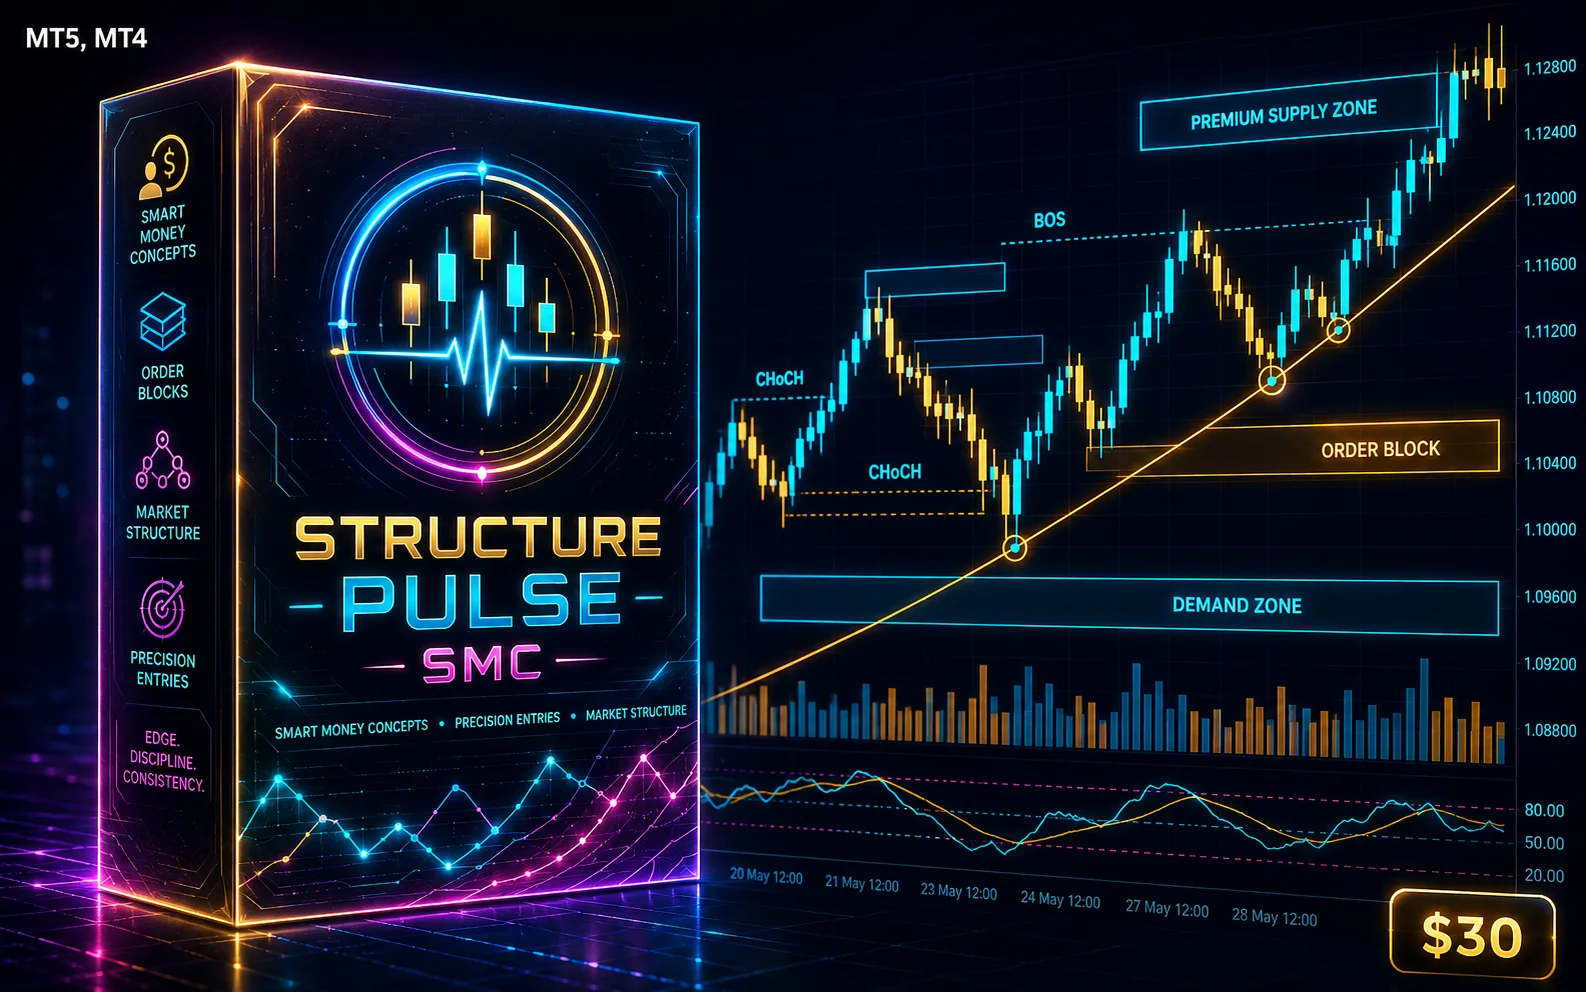
Structure Pulse SMC
Structure Pulse SMC - is a multifunctional indicator for MetaTrader 4/5 that combines market structure, liquidity, trend, and volume analysis in one visual system. It helps traders assess current market conditions faster, identify potential entry points, and plan trade management levels in advance. Instead of using numerous separate indicators and manually drawn lines, Structure Pulse SMC presents a clear market picture directly on the chart: structural direction, key level breakouts, liquidity sweeps, imbalance zones, volume levels, and confirmed BUY or SELL signals.
Market Structure Analysis The indicator automatically detects and displays the main elements of market structure:
HH — Higher High
HL — Higher Low
LH — Lower High
LL — Lower Low
BOS — Break of Structure
CHOCH — Change of Character
These labels help identify trend development, continuation points, and potential changes in market direction. Traders do not need to mark every local high and low manually, as the structure is displayed automatically on the chart.
Liquidity Analysis Structure Pulse SMC tracks liquidity areas and identifies: BSL Sweep — liquidity sweep above previous highs
SSL Sweep — liquidity sweep below previous lows
These events may indicate false breakouts, stop-loss collection, and a possible price reaction. Liquidity labels are displayed separately from trading signals, allowing traders to distinguish between a market event and a confirmed entry opportunity.
Order Blocks, FVG, and Equilibrium The indicator visualizes important Smart Money Concepts elements:
bullish and bearish Order Blocks
Fair Value Gap zones
the Equilibrium 50% level between relevant structural extremes
The zones use a restrained visual style and do not heavily cover the candlestick chart. Each type of object can be enabled, disabled, and configured separately.
Fixed Range Volume Profile The indicator includes a built-in Fixed Range Volume Profile. It analyzes a selected number of closed candles and displays tick-volume distribution across different price levels.
The following levels are shown:
POC — the price level with the highest volume
VAH — the upper boundary of the Value Area
VAL — the lower boundary of the Value Area
HVN — high-volume areas
LVN — low-volume areas
The Volume Profile is positioned on the right side of the chart without covering the latest candles. The calculation depth, number of price levels, profile width, and Value Area percentage can be adjusted.
EMA and ADX Signal Confirmation BUY and SELL signals pass through additional filtering.
The EMA determines the main market direction:
BUY signals are considered when the price is above the EMA
SELL signals are considered when the price is below the EMA
ADX evaluates trend strength. The indicator also analyzes the relationship between the +DI and -DI lines, so each signal must correspond not only to the market structure but also to the actual trend direction.
When the filtering conditions are not met, the indicator does not create an entry arrow, trading levels, or an alert. This helps reduce weak and countertrend signals.
Trade Visualization When a signal is confirmed, a compact arrow and a BUY or SELL label appear on the chart. The indicator can also automatically display:
Entry price
Stop Loss
TP1
TP2
TP3
The Stop Loss and Take Profit distances are specified in points. The Stop Loss line can be enabled or disabled separately. Labels and arrows are automatically positioned to reduce overlap with BOS, CHOCH, and liquidity-sweep markings.
Information Panel The compact information panel displays the most important market information:
current BUY, SELL, or WAIT status
market structure direction
price position relative to the EMA
current ADX value
+DI/-DI direction
Order Block status
FVG status
latest liquidity event
The panel makes it easier to understand the overall market situation and check whether structure, trend, and volume confirm one another.
Ready-Made Color Schemes Several visual themes are available:
standard MetaTrader 4/5 chart
Cyan/Magenta
Emerald Green
Graphite Purple
custom color scheme
Traders can use a modern dark interface or keep the familiar standard MetaTrader 5 chart appearance. When the indicator is removed, the original chart colors and settings are restored.
Structure Pulse SMC is designed for traders who use market structure, Smart Money Concepts, liquidity, and volume analysis. It combines the main analytical elements in one tool and helps traders move faster from market assessment to a structured trading plan.